

ELSEVIER Editorial
James Watson’s most inconvenient truth: Race realism and the moralistic fallacy
J. Philippe Rushton
Department of Psychology, The University of Western Ontario, London, Canada
Arthur R. Jensen
The University of California at Berkeley, Berkeley, CA
Recent editorials in this journal have defended the right of eminent biologist James Watson to raise the unpopular hypothesis that people of sub-Saharan African descent score lower, on average, than people of European or East Asian descent on tests of general intelligence. As those editorials imply, the scientific evidence is substantial in showing a genetic contribution to these differences. The unjustified ill treatment meted out to Watson therefore requires setting the record straight about the current state of the evidence on intelligence, race, and genetics.
In this paper, we summarize our own previous reviews based on 10 categories of evidence: The worldwide distribution of test scores; the g factor of mental ability; heritability differences; brain size differences; trans-racial adoption studies; racial admixture studies; regression-to-the-mean effects; related life-history traits; human origins research; and the poverty of predictions from culture-only explanations. The preponderance of evidence demonstrates that in intelligence, brain size, and other life-history variables, East Asians average a higher IQ and larger brain than Europeans who average a higher IQ and larger brain than Africans. Further, these group differences are 50–80% heritable. These are facts, not opinions and science must be governed by data. There is no place for the ‘‘moralistic fallacy’’ that reality must conform to our social, political, or ethical desires.
Introduction
When one of the greatest biologists of the 20th century, Nobel-Prize winner James Watson, noted that people of African descent average lower on intelligence tests than do Europeans and East Asians, he was excoriated by the mass media and elements of the scientific elite and forced to retire from his position as Chair of the Cold Spring Harbor Laboratory [9,34]. Watson’s treatment was especially egregious given that, in point of scientific fact, more than a century-and-a-half of evidence corroborates his statement. Moreover, supportive new data and analyses appear regularly in mainstream, peer-reviewed journals in the relevant scientific disciplines. Evidence to the contrary is exceedingly weak. Most of the opposition to the genetic hypothesis consists of mere moralizing and worse, the creation of a threatening and coercive atmosphere incompatible with academic freedom, free enquiry, and the civil liberties of a truly democratic society. An enormous gulf separates the politically correct gatekeepers and enforcers from true experts in the behavioral sciences.
Nor is Watson’s case unique. He is but the latest in a long line of academics that have been pilloried and defamed (detailed accounts given in Hunt [20]). The others include Nobel-Prize winner William Shockley, Hans Eysenck, Linda Gottfredson, Richard Lynn, Richard Herrnstein, Charles Murray, Christopher Brand, Glayde Whitney, Helmuth Nyborg, and Tatu Vanhanen. The present writers too have endured their share of attacks. The taboo on race will surely become a major topic of investigation by sociologists of knowledge. There is no parallel to it in the history of science. It is uniquely imposed, mainly through self-censorship, by members of the Western intelligentsia in their own academy – which prides itself on a tradition of academic freedom, open inquiry, and the unfettered discovery, systematization, and pursuit of knowledge and its dissemination to the general public.
Despite the chilling effect described, we (and the others) have persevered in part because of the great importance of the topic, the fascinating data it provides, and the theoretical issues it raises [21]. One of us (JPR) traveled to South Africa to collect new IQ data from highly-selected Black students at the prestigious University of the Witwatersrand in Johannesburg. Seven studies were published based on these data yielding a median IQ of 84 (range 77–103). Assuming that African university students are 1 standard deviation (15 IQ points) above the mean of their population, as university students typically are, a median IQ of 84 is consistent with a (very low) general population mean of 70. [48]
Because many consider the race–IQ hypothesis incendiary, it is essential to thoroughly examine all the relevant data. We did this in our 60-page review, ‘‘Thirty Years of Research on Race Differences in Cognitive Ability,’’ which was published as the lead article in the June 2005 issue of Psychology, Public Policy, and Law, a journal of the American Psychological Association [51].In the current article we summarize and update those findings (more complete statistical details and references can be found there). Again, the preponderance of evidence argues that it is more probable than not that the genetic contribution to racial group differences in intelligence, brain size and other life-history variables is between 50% and 80%. A good introduction to the issues involved is Bartholomew [1].
On the basis of the 10 research categories listed below, we concluded that the mean 15-point Black–White IQ difference in the US is about 80% heritable and that the 30-point African/non-African IQ difference is about 50% heritable (much of the balance being attributable to cultural and nutritional differences). The evidence demonstrates that:
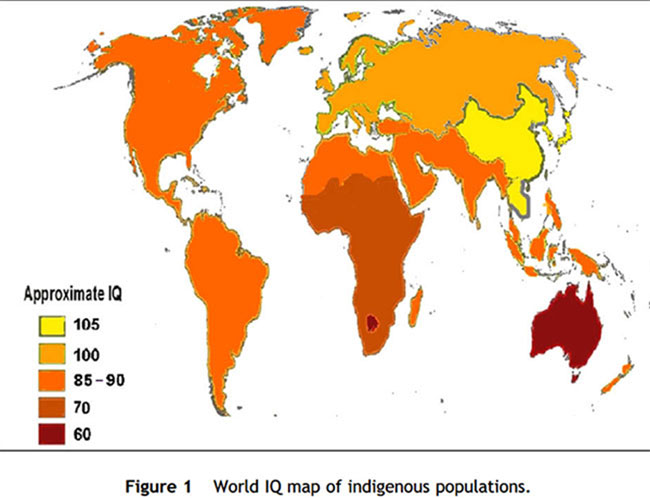
(1) the mean IQ around the world is 106 for East Asians, 100 for Whites, 85 for US Blacks, and 70 for sub-Saharan Africans;
(2) race differences are most pronounced on the more g-loaded IQ subtests (g being the general factor of mental ability or first principal component; it picks up the ‘‘active ingredient’’ in intelligence tests);
(3) race differences are most pronounced on the IQ subtests whose scores show the most heritability;
(4) racial differences in brain size parallel the IQ differences; (5) people of mixed-race ancestry average IQ scores intermediate to their two parental populations;
(6) trans-racial adoption studies show that Black, mixed-race, and East Asian children raised by White parents have IQs closer to the average of their biological parents than to the White mean;
(7) people’s offspring and siblings show regression to their respective racial IQ means;
(8) the races differ consistently across 60 related life-history traits;
(9) the racial IQ differences agree with the latest accounts of human origins (that is, the out of Africa model); and finally
(10) environmental explanations of racial IQ differences have been tested and repeatedly shown to be inadequate.


National IQs have been reported for 192 countries around the world [30,32]. The results show that the average IQ for East Asians centers around 106; for Whites, about 100; for US Blacks about 85, and for sub-Saharan African Blacks about 70 (Fig. 1). The same rank-order of race differences is found for ‘‘culture-fair’’ tests and reaction-time measures. Reaction-time tasks are so easy that all children can do them in less than one second [25,26]. More intelligent children, measured by conventional IQ tests, perform faster on these tasks. East Asians average faster reaction times than Whites who, in turn, have faster reaction times than Blacks.
Mean IQs differ much less within major population groups (that is, races) than between them. Whites have IQs close to 100 whether they live in Europe, Canada, Australia, New Zealand, or South Africa, whereas Blacks in sub-Saharan Africa have IQs closer to 70 regardless of whether they live in East, West, Central, or Southern Africa – or whether the data were collected in the 1920s or the 2000s. This worldwide pattern contradicts the hypothesis that the low IQ of American Blacks is due to the legacy of slavery, segregation, and ‘‘White racism.’’ Many of the African countries showing a mean IQ of 70, such as Nigeria and Ghana, have been independent for half a century, and the Caribbean island of Haiti for two centuries. However, there has been no documented improvement in cultural achievement or in IQ scores.
Currently, the existence of the 15- to 18-point IQ difference (1.1 standard deviations) between Blacks and Whites in the US is not in itself a matter of empirical dispute. Only its explanation is under discussion. For example, Herrnstein and Murray [18] analyzed data from the 12-year National Longi- tudinal Survey of Youth. They found that most 17-year-olds with high scores on the Armed Forces Qualification Test (AFQT), regardless of ethnic background, went on to occupational success by their late 20s and early 30s. Those with low scores were more inclined to welfare dependence. The study also found that the average IQ for African Americans was lower than those for Latino, White, East Asian, and Jewish Americans (85, 89, 103, 106, and 113, respectively). Similarly, a meta-analytic review by Roth et al. [39] confirmed the 1.1 standard deviation Black–White IQ difference for a total sample of 6,246,729 corporate, military, and higher education testees.
Nor can there be doubt that the average African IQ of 70 is reliable and not due to a ‘‘fluke,’’ or to sampling error, or to the prejudice of investigators. Lynn [30] reviewed over two dozen studies from West, Central, East, and Southern Africa and consistently found an average IQ of 70. For example, in Kenya, Robert Sternberg et al. [61] administered the Colored Progressive Matrices to 85 12- to 15- year-olds who scored an IQ equivalent of 70. In Tanzania, Sternberg et al. [60] gave the Wisconsin Card Sorting Test to 358 11- to 13-year-old; they received a score equivalent to the 5th percentile on American norms (that is, IQ = 75). After training on how to solve problems such as those on the test, the children’s scores improved, but only to about the 9th percentile on American norms (IQ < 80).
It is also generally agreed that because test scores provide the best predictors of educational and economic success, average group differences have important societal outcomes. Further, the Black–White IQ difference shows up before 3 years of age on most standardized test batteries, even after matching on maternal education and other variables. Therefore the race differences are not due to poorer educational opportunities since this has not yet begun to exert an effect. (The East Asian IQ advantage appears by five years of age.) Because the same differences are found on relatively culture-free tests, and because the tests show similar patterns of internal item consistency and predictive validity for all groups, many psychometricians have concluded that the tests are valid measures of racial differences.
In Africa too, IQ scores are demonstrably valid. For example, Kendall et al. [28] showed that test scores predicted school grades and job performance equally well for Africans as for non-Africans (i.e., 0.20 to 0.50). Similarly Sternberg et al.’s [61] study of Kenyan 12- to 15-year-old found that IQ scores predicted school grades with a mean r= 0.40. In Rushton et al.’s [53,54] studies of African and non-African university students, scores on one IQ test correlated with scores on another IQ test 3 months earlier (0.60 for Africans; 0.70 for non-Africans) and with end-of-year-exam marks measured 3 months later (0.34 for Africans; 0.28 for non-Africans). The only demonstrated reliable example of bias is the rather obvious one of vocabulary for groups whose first language is not English. Even here, however, language accounts for only about 7 IQ points (out of the 30-point difference).
Race differences are most pronounced on the more g-loaded components of tests
Charles Spearman [59] coined the term g for the general factor of mental ability (or ‘‘general intelligence’’). A test’s g loading is the best predictor not only of school grades and workplace performance, but also of all the other indicators and correlates of intelligence – including biological variables such as brain size, reaction times, and heritability estimates as calculated from twin studies [25]. Race differences are repeatedly found to be higher on more g-loaded tests. g is the ‘‘active ingredient’’, if you will, of IQ scores, and is embedded to a greater or lesser extent in every intelligence test question. Because Blacks average lower scores on the more g-loaded tests, the Black–White-East Asian IQ differences are unlikely to be the result of any idiosyncratic cultural peculiarities in this or that test. They are more likely to be due to heredity. True, test constructors could, in principle, reduce the Black–White difference to zero (or even reverse it) by including only non-g items, or those negatively loaded on g, but the tests would then have no predictive power.
Studies in Southern Africa have also found that the race differences are mainly on the g factor. Lynn and Owen’s [31] analysis of thousands of high school students and Rushton et al.’s [53] analyses of hundreds of university students consistently found the African-White differences were mainly on g. So too were the differences between Africans, Whites, East Indians, and Coloreds. Importantly, g loadings calculated from the East Indian sample predicted the magnitude of the differences between Africans and Whites, which indicates the remarkable generalizability of the phenomenon. In one study Rushton and Jensen [50] found 77% of the African-White difference was on the g factor.
The gene–environment architecture of IQ is the same in all races
Studies of Black, White, and East Asian twins have shown that the heritability of IQ is about the same in all races (50% or higher). There has been no indication of any special cultural influence – such as extreme deprivation, or being raised as a visible minority – at work in one group and not in the others. If poverty, slavery, and White racism had operated to suppress Blacks’ natural levels of intelligence, it would make the heritability of their IQ scores substantially lower than the heritability for Whites. When tested empirically by comparing several hundred pairs of Black and White twins aged 12- to 18-years on the Basic Test Battery, the Primary Mental Abilities test, and the Cattell Culture Fair Intelligence test, Osborne [36] found heritabilities of about 50% in each group (The heritabilities in the Basic, Primary, and Cattell tests were, respectively: Whites – 0.61, 0.37, and 0.71; Blacks – 0.75, 0.42, and 0.19.).
The genetic basis of Black–White differences is also shown by the differences being more pro- nounced on the more heritable components of tests. For example, Jensen [22] calculated the environmentalities (that is, a measure of the non-genetic component) for 16 tests and found that they were inversely related to the magnitude of the Black–White differences ® = 0.70; P < 0.05). Rushton [43] found a correlation of r = 0.48 ( P < 0.05) between genetic influence on 11 tests estimated from inbreeding depression in cousin marriages in Japan and Black–White differences. Rushton et al. [49] calculated the genetic influence on each of the items of the Raven’s tests using raised-apart-twin similarities and found, in 55 comparisons including several independent samples of African high school and university students, that the European–African differences were consistently larger on the more heritable items.
Another way to test the hypothesis that there is some special ‘‘Factor X ’’ that lowers the IQ of Blacks is to compare the similarity of the correlations between background variables (such as the home environment and the peer group) and out- come measures (such as scholastic achievement and delinquency rates). If a Factor X exists, some of these correlations should be lower for Blacks. A series of studies on some very large samples have tested this hypothesis and disconfirmed it
[41]. For example, Rowe et al. [42] examined test scores for 8528 Whites, 3392 Blacks, 1766 Hispanics, and 906 Asians and found the exact same relation of background variables and outcome variables in each race; there was no evidence of any special factor that acted systematically to lower the IQ scores of Blacks.
Brain size differences
Larger brains are more intelligent because they contain more neurons and synapses and can process information more efficiently. Two dozen studies using magnetic resonance imaging (MRI) have shown that brain size is related to IQ differences (within-race) with a correlation of about 0.40. This is much higher than the 0.20 correlation found using indirect head size measures, though the lat- ter correlation is also reliable and significant. A functional relation between brain size and cognitive ability has been found in four studies finding that the correlation between brain size and IQ holds true within-families as well as between families [4,15,23,24]; although one study failed to do so: [56]. The within-family finding is of special interest because it controls for most of the sources of variance that distinguish families, such as social class, styles of child rearing, and general nutrition, that differ between families. The largest of these studies measured head size at birth and IQ at age 18 at the time of conscription in the Swedish military [4]. Analyses were made of data on 96,189 males who had at least 1 full brother similarly measured.
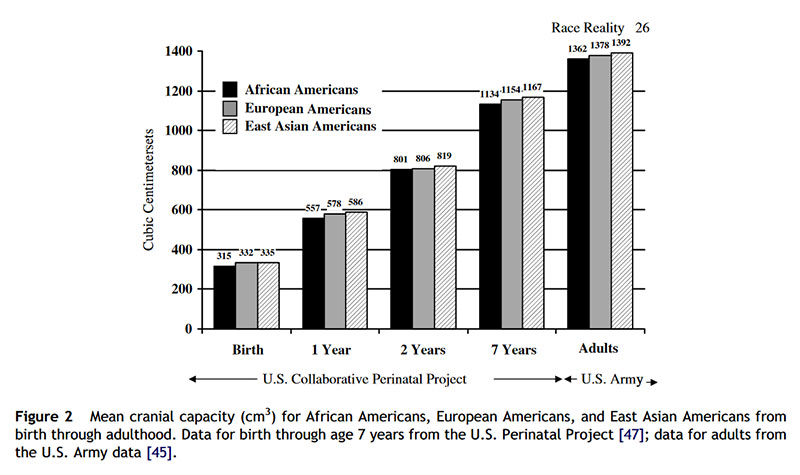
Even before birth, race differences in brain size can be observed. Schultz [57] found that from the 9th week of intrauterine life, 165 Black fetuses averaged a smaller brain case and larger face than did 455 White fetuses. The differences became more prominent over the course of fetal development. From birth to age 7 years, race differences were found for measures of head circumference and IQ from 40,000 children in the US National Collaborative Perinatal Project [6,47]. The results showed that at birth, 4 months, 1 year, and 7 years, the East Asian children averaged larger cranial volumes than White children who averaged larger cranial volumes than Black children (Fig. 2 ). Within each group, children with larger head sizes obtained higher IQ scores (mean r = 0.20). Moreover, since the East Asian children, who averaged the largest crania, were the shortest in stature and the lightest in weight, and the Black children, who averaged the smallest crania, were the tallest in stature and the heaviest in weight, the differences in brain size were not due mere correlates of body size.
Dozens of studies from the 1840s to the 1990s, using four different methods of measuring brain size – MRI, endocranial volume measured from empty skulls, wet brain weight at autopsy, and external head size measurements – all yield similar results. Using MRI, for example, Harvey et al. [17] found that 41 Africans and West Indians in the United Kingdom had a smaller average brain volume than 67 Caucasians. In another British study, Jones et al. [27] found Whites averaged a 30 cm (3) larger cranial volume and smaller ventricles than Afro-Caribbeans.
As far back as 1849, the American anthropologist Samuel George Morton [35] filled over 1000 skulls with packing material and found that Blacks averaged about five cubic inches less cranial capacity than Whites. These results have been confirmed [16,58,65]. The largest study of race differences in endocranial volume was by Beals et al. [2] with measurements of up to 20,000 skulls from around the world. They found that East Asians, Europeans, and Africans averaged cranial volumes of 1415, 1362, and 1268 cm (3), respectively. Also in the 19th century, Paul Broca [5] measured brain weight at autopsy and reported that not only did Whites average heavier brains than Blacks, but also they had more complex convolutions and larger frontal lobes. These results have likewise been replicated with several studies finding an average Black–White difference of about 100 g [3,33,37,66]. In a study of 1261 American adults, Ho et al. [19] found that 811 White Americans averaged 1323 g and 450 Black Americans averaged 1223 g. Since the Blacks and Whites were similar in body size, differences in body size cannot explain away the differences in brain weight.
Cranial volume has also been estimated from external head size measurements (length, width, height). For example, Rushton [44] examined head size measures in 24 international military samples collated by the US National Aeronautics and Space Administration (NASA) and, after adjusting for the effects of body height, weight, and surface area, found cranial capacity for East Asians was 1460 cm 3 and for Europeans, 1446 cm 3. Rushton [45] also calculated average cranial capacities for East Asians, Whites, and Blacks from a stratified random sample of 6325 US army personnel and found an average of 1416, 1380, and 1359 cm (3), respectively. This study allowed precise adjustments for all kinds of body size measures. Yet adjusting for these did not erase the differences in cranial capacity.
Summarizing the world literature on race differences in brain size for the three major methods (autopsies, endocranial volume, and head size measures) as well as head measurements corrected for body size, gives results (in cm 3 ): East Asians = 1364; Whites = 1347; and Blacks = 1267. The overall mean for East Asians was 17 cm 3 more than that for Whites and 97 cm 3 more than for Blacks. Within- race differences due to differences in method of estimation averaged 31 cm 3. Since one cubic inch of brain matter contains millions of brain cells and hundreds of millions of synapses or neural connections, race differences in average brain size may explain their differences in average IQ.
Trans-racial adoption studies
Trans-racial adoption studies provide one of the most powerful methods for studying race differ- ences. They are the human analog to the cross-fostering method commonly used in animal research. Human adoption is clearly a massive environmental intervention.
Studies of Korean and Vietnamese children adopted into White homes show that although as babies many had been hospitalized for malnutrition, they nonetheless grew to have IQs 10 or more points higher than their adoptive national norms [10,14]
.
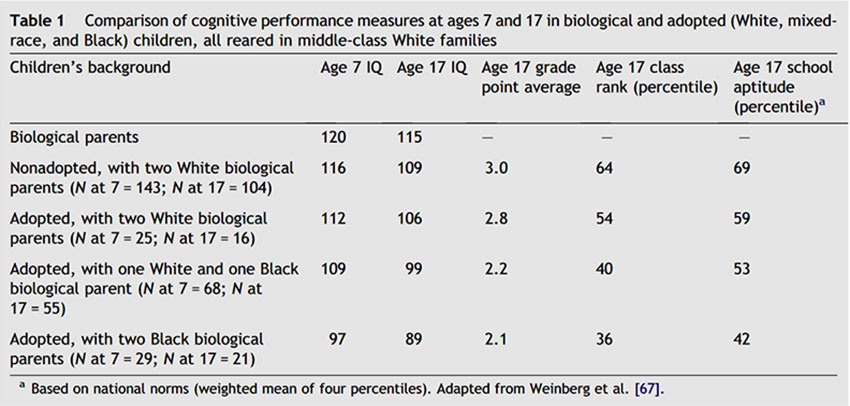
By contrast, Black and mixed-race (Black–White) children adopted into White middle-class families have lower average scores than the White siblings with whom they had been raised or than with other White children adopted into similar homes. The Minnesota trans-racial adoption study is the largest and the best-known of these studies and the only one that includes a longitudinal follow-up, with testing of the same children at ages 7 and 17 years [55,67]. The study compared the IQ and academic achievement scores of Black, White, and mixed-race children who were adopted into upper-middle-class White families in Minnesota whose mean IQ was 120 (much higher than the population Black adoptee’s mean I of 100). The biological children of the adopting parents were also tested.
The first testing of 265 children was carried out in 1975 when they were 7 years old and the second in 1986 when the children were 17 years old. Table 1 gives the results. The evidence for the genetic theory grew stronger as the children grew older. At age 17 adopted White children had an average IQ of about 106; mixed-race adoptees, an IQ of 99; and adopted Blacks, an IQ of 89. Although the Black adoptee’s mean IQ of 89 was slightly above the national Black mean of 85, it was not above the Black mean for Minnesota. Further, school grades, class ranks, and aptitude tests all showed this same pattern. Growing up in a White middle- class home produced little or no lasting increase in the IQs of Black children.
Racial admixture studies
Dozens of studies have found that lighter-skinned African Americans have average IQs higher than their darker-skinned counterparts [41]. For example, Lynn [29] examined the National Opinion Research Center (NORC) survey of a representative sample of the adult population. The 442 Blacks were asked whether they would describe themselves as ‘‘very dark,’’ ‘‘dark brown,’’ ‘‘medium brown,’’ ‘‘light brown,’’ or ‘‘very light.’’ The correlation between these self-ratings and a 10-word vocabulary test score was 0.17 (P < 0.01). Rowe [40] examined the National Longitudinal Study of Adolescent Health and found the Black adolescents averaged a lower verbal IQ than the White adolescents. The mixed-race mean fell between those of the other two groups.
The Black American average IQ of 85 (15 points higher than the sub-Saharan African average of 70) is also consistent with the genetic hypothesis because genetic analyses estimate an average of 20–25% White admixture in African Americans [8]. Also, the mixed-race ‘‘Colored’’ population of South Africa has an average IQ of 85, intermediate to the respective African and White means of 70 and 100 [48]. These findings are not due to light- er-skinned Blacks being treated better through ‘‘expectancy effects’’ or ‘‘labeling theory.’’ In the Minnesota trans-racial adoption study, for example, some children were misclassified, with their adoptive parents wrongly believing that the mixed-race children had two Black biological parents. Yet these children averaged the same IQs as those of other mixed-race children correctly be- lieved by their adoptive parents to have had one Black and one White biological parent [55].
Early studies of brain weight data fit with the genetic admixture hypothesis as well. Bean [3] found, as did Pearl [37], that the greater the amount of White admixture (judged independently from skin color), the higher the mean brain weight at autopsy in Black groups. Subsequently, Rushton [47] examined 37 East Asian–European hybrids from the US National Collaborative Perinatal Project and found that they fell intermediate in brain size and IQ to the non-mixed parental groups.
Blacks and Whites regress toward their predicted (and different) means
Basic genetic theory predicts that the IQ of off-spring will regress towards the mean IQ of the population group from which the parents come. This has been amply documented for a number of physical traits in humans and in other species. Regression-to-the-mean is seen when individuals with high IQ scores mate. Their children tend to show lower scores than their parents. The converse happens for low IQ parents; they have children with somewhat higher IQs. This is because the parents pass on some, but not all, of their exceptional genes to their offspring. It is analogous to rolling a pair of dice and having them come up two 6’s or two 1’s. The odds are that on the next roll, you will get some value that is not quite as high (or as low). Genetic theory predicts the precise magnitude of the regression effect. Black children with par- ents of IQ 115 regress to the Black IQ average of 85, while White children with parents of IQ 115 regress to the White IQ average of 100. Regression to a lower average IQ helps to explain the fact that Black children born to high IQ, wealthy, Black parents have test scores 2–4 points lower than do White children born to low IQ, poor White parents.
In one study, Jensen [22] tested the regression predictions using data from siblings (900 White sibling pairs and 500 Black sibling pairs). These provide an even better comparison than parent–offspring comparisons because siblings share very similar environments. Black and White children matched for IQ had siblings who had regressed approximately halfway to their respective racial means rather than to the mean of both races combined. For example, when Black children and White children were matched for IQs of 120, the siblings of Black children averaged close to 100, whereas the siblings of White children averaged close to 110. A reverse effect was also found for children matched at the lower end of the IQ scale. When Black children and White children were matched for IQs of 70, the siblings of the Black children averaged about 78, whereas those of the Whites averaged about 85. Throughout the range of IQ from 50 to 150 the results were exactly as predicted by genetic theory, not by culture-only theory.
The riddle of the three-way pattern of race differences
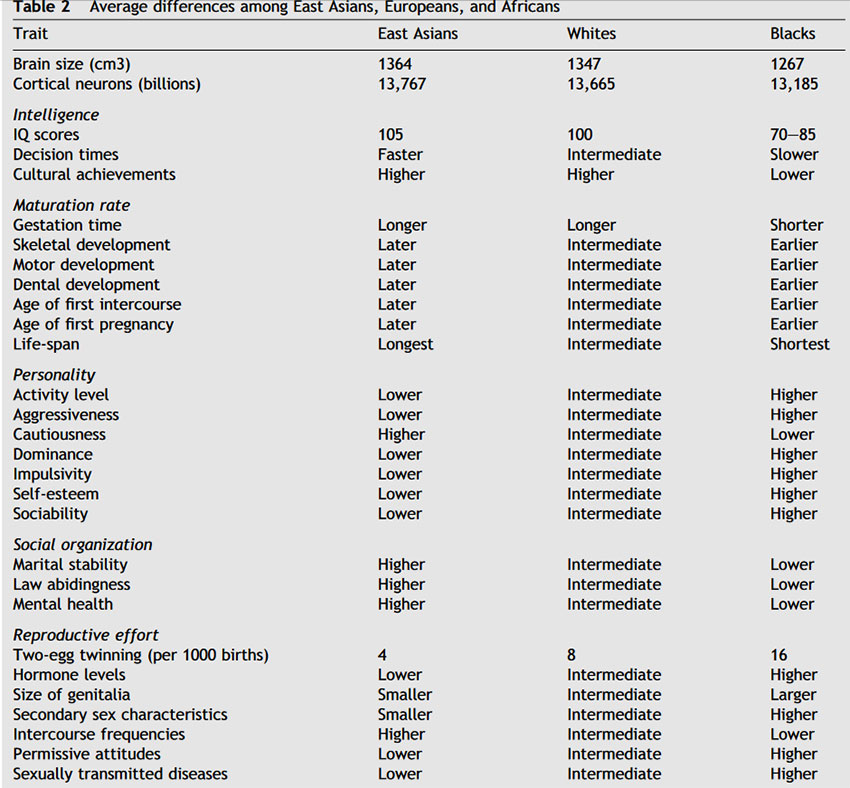
On a wide variety of attributes, East Asians and Blacks fall at the two ends of a continuum [46,64]. Whites are in the middle. In addition to brain size and IQ, this shows up on a suite of 60 other life-history variables. These include speed of maturation and longevity, personality and temperament, family stability and crime, and sexual behavior and fertility.
Table 2 lists some of these differences. One striking example: Around the world the rate of dizygotic (i.e. two-egg) twinning is less than four per 1000 births among East Asians, eight among Whites, and 16 or greater among Blacks [7,46]. The tendency to produce dizygotic twins is heritable and mediated by sex hormones. Another example: Black babies sit, crawl, walk, and put on their clothes earlier than Whites or East Asians. These racial group differences have been found to be heritable. For example, children of mixed Black–Japanese ancestry average a faster rate of skeletal development than do children of mixed Japanese–White ancestry, who average a faster rate of skeletal development than do children with two Japanese parents [12]. For walking: East Asians, 13 months; Whites, 12 months; Blacks, 11 months. Blacks also have an earlier age of sexual maturity than do Whites, who in turn have an earlier age than do East Asians, whether measured by age of first menstruation, first sexual experience, or first pregnancy [46]
.
Race differences and human origins research
The current consensus view of human origins, the ‘‘out-of-Africa’’ theory, posits that Homo sapiens arose in Africa about 150,000 years ago and then expanded northward beyond Africa about 100,000 years ago, with a European–East Asian split about 41,000 years ago. Evolutionary selection pressures were different in the hot savanna, where Africans lived, than in the cold northern regions Europeans experienced, or the even colder Arctic regions where East Asians evolved. Thus, the further north the ancestral populations migrated out of Africa, the more they encountered the cognitively-demanding problems of gathering and storing food, gaining shelter, making clothes, and raising chil- dren successfully during prolonged winters. As these populations evolved into present-day East Asians and Europeans, the ecological pressures selected for larger brains, slower rates of maturation, and lower levels of sex hormone, and all the other life-history characteristics.
Culture-only theory hypotheses fail to account for the race–IQ differences
Contrary to many hopes and some claims, the narrowing of the gap between Black–White social conditions has not led to any change in the magnitude of the Black–White IQ difference in over 100 years. Massive society-wide interventions such as ending segregation, the subsequent nationwide program of school busing to achieve racial balance, and the Head Start programs have failed to reduce the differences. Head Start programs did produce modest gains in school retention and graduation rates among Whites – but not Blacks. Other large scale, often well-publicized, countywide amelioration projects (such as the $2 billion program in affluent Montgomery County, Maryland, as well as the Kansas City, Missouri, school district, under judicial supervision since 1985), have not reduced the Black– White achievement gap (despite low student–teacher ratios and computers in every classroom).
Whenever closely examined, culture-only theories have proven incapable of explaining race differences in IQ. Adjusting for socioeconomic status only reduces the Black–White IQ difference by about one-third. Nor does the evidence support other culture-only hypotheses such as test bias, test anxiety, or the consequences of being a minority in a White society. Culture-only theories have proven especially inadequate in explaining East Asian IQs because, despite lower socioeconomic conditions, they average slightly higher in IQ and educational achievement than do Whites. One culture-only hypothesis currently promoted is based on the secular increase in test scores. It is known as the Flynn Effect after James Flynn’s [13] demonstration that the average IQ in several countries has systematically increased by about 3 points a decade over the last 50 years. He extrapolated these findings to imply that the 15-point IQ difference between Blacks and Whites will gradually disappear over time. However, analyses show that the Flynn Effect is not on the g factor, the principal source of the Black–White difference [68]. Moreover, there has been no narrowing of the Black–White IQ difference over the last 100 years [52]
Of course, some maintain that ‘‘races’’ do not exist at the genetic level. This argument is contradicted by Tang et al.’s [62] study of 3636 individuals who donated a DNA sample and identified themselves as being White, East Asian, African–American, or Hispanic. The study found that the self-identifications clustered almost perfectly according to 326 measured DNA markers. Only five individuals had DNA that matched a racial/ethnic group different than the box they had checked to
classify themselves. That is an error rate of only 0.14%.
Coroners in crime labs regularly identify race from a skeleton or even just the skull. They can determine race from blood, hair, teeth, or semen as well. To deny the biological reality of race is unscientific and unrealistic. Genetic studies confirm that race is real. A genetic hypothesis predicts that for those Black individuals who possess more White genes, their physical, behavioral, and other characteristics will approach those of Whites. These procedures have become routine for evaluating admixture in genetic studies of dis- ease [38]. They can be recommended for studies of IQ.
Wanted: More race realism, less moralistic fallacy
The ‘‘naturalistic fallacy,’’ identified by philosopher David Hume (1711–1776), occurs when reasoning jumps from statements about what is to a prescription about what ought to be. An example of the naturalistic fallacy would be approving of all wars if scientific evidence showed warfare was part of human nature. The converse of the naturalistic fallacy is the ‘‘moralistic fallacy’’ – jumping from prescriptions about what ought to be to statements about what is. An example of the moralistic fallacy: Claiming that, because warfare is wrong, it cannot be part of human nature. The term ‘‘moralistic fallacy’’ was coined by Harvard University microbiologist Bernard Davis [11] in response to demands for ethical guidelines to control the study of what could allegedly be- come ‘‘dangerous knowledge’’... such as the genetic basis of IQ. For well over a generation, the study of the genetic and racial aspects of IQ has given rise to the best examples we have of the moralistic fallacy in action. Happily, under the sheer weight of evidence, there are now signs that this anti- intellectual and unscientific prohibition is breaking down, at least in the academic world.
Despite repeated claims to the contrary, there has been no narrowing of the 15- to 18-point aver- age IQ difference between Blacks and Whites (1.1 standard deviations). The differences are as large today as when first measured nearly 100 years ago. Racial group differences, and the associated gaps in living standards, education levels etc., are rooted in factors that are largely heritable, not cultural. For example, Lynn and Vanhanen [32] found that national IQ scores correlate 0.68 with per capita income and rate of economic development. They further show that national IQs cause a number of other social phenomena, such as adult literacy (0.64), enrolment in tertiary education (0.75), life expectancy (0.77), and democratization (0.57). Templer and Arikawa [63] found that per capita income and IQ were related to skin color in international comparisons.
Subsequently, Templer [64] found that national IQs and skin predict infant mortality, fertility, and even HIV/AIDS rates. IQ differences are attributable more to differences in brain size than to social, economic, or political factors. There is little or no value in denying reality. Improving opportunities and removing arbitrary barriers is a worthy ethical goal. Equal opportunity is laudable. But we must realize that it will result in equitable, though unequal outcomes.
Expanding on the application of his ‘‘default hypothesis’’ that Black–White differences are based on aggregated individual differences, themselves based on both genetic and environmental contributions, Jensen [26] proposed ‘‘two laws of individual differences’’– (1) individual differences in learning and performance increase as task complexity increases, and (2) individual differences in performance increase with practice and experience (unless there is a low ceiling on proficiency). Consequently, the more we remove environmental barriers and improve everybody’s intellectual performance, the greater will be the relative influence of genetic factors (because the environmental variance is being removed). However, this means that equal opportunity will result in unequal outcomes, within-families, between-families, and between population groups. The fact that we have learned to live with the first, and to a lesser degree the second, offers some hope we can learn to do so for the third.
References
[1] Bartholomew DJ. Measuring intelligence: facts and fallacies. Cambridge: Cambridge University Press; 2004.
[2] Beals KL, Smith CL, Dodd SM. Brain size, cranial morphology, climate, and time machines. Curr Anthropol
1984;25:301–30.
[3] Bean RB. Some racial peculiarities of the Negro brain. Am J Anat 1906;5:353–432.
[4] Bergvall N, Iliadou A, Tuvemo T, Cnattingius S. Birth characteristics and risk of low intellectual performance in early adulthood: are the associations confounded by socioeconomic factors in adolescence or familial effects? Pediatrics 2006;117:714–21.
[5] Broca P. Sur les craˆnes de la caverne de l’homme mort (loere). Revue d’Anthropologie 1873;2:1–53.
[6] Broman SH, Nichols PL, Shaughnessy P, Kennedy W. Retardation in young children. Hillsdale, NJ: Erlbaum; 1987.
[7] Bulmer MG. The biology of twinning in man. Oxford, UK: Clarendon Press; 1970.
[8] Chakraborty R, Kamboh MI, Nwankwo M, Ferrell RE. Caucasian genes in American blacks. Am J Hum Genet 1992;50:145–55.
[9] Charlton BG. First a hero of science and now a martyr to science: the James Watson affair — political correctness
crushes free scientific communication. Med Hypotheses 2008;70:1077–80.
[10] Clark EA, Hanisee J. Intellectual and adaptive performance of Asian children in adoptive American settings. Dev Psychol 1982;18:595–9.
[11] Davis B. The moralistic fallacy. Nature 1978;272:390.
[12] Eiben OG. Growth and physical fitness of children and youth at the end of the XXth Century Preliminary report. Int J Anthropol 1998;13:129–36.
[13] Flynn JR. What is intelligence? Beyond the flynn effect. New York: Cambridge University Press; 2007.
[14] Frydman M, Lynn R. The intelligence of Korean children adopted in Belgium. Pers Individual Differences 1989;10: 1323–6.
[15] Gignac G, Vernon PA, Wickett JC. Factors influencing the relationship between brain size and intelligence. In: Nyborg H, editor. The scientific study of general intelligence: tribute to Arthur R. Jensen. London: Elsevier; 2003. p.93–106.
[16] Gordon HL. Amentia in the east African. Eugenics Rev 1934;25:223–35.
[17] Harvey I, Persaud R, Ron MA, Baker G, Murray RM. Volumetric MRI measurements in bipolars compared with schizophrenics and healthy controls. Psychol Med 1994;24:689–99.
[18] Herrnstein RJ, Murray C. The bell curve. New York, NY: Free Press; 1994.
[19] Ho KC, Roessmann U, Straumfjord JV, Monroe G. Analysis of brain weight: I & II. Arch Pathol Lab Med 1980;104: 635–45.
[20] Hunt M. The new know-nothings: the political foes of the scientific study of human nature. New Brunswick, NJ: Transaction; 1999.
[21] Jensen AR. How much can we boost IQ and scholastic achievement? Harv Educ Rev 1969;39:1–123.
[22] Jensen AR. Educability and group differences. Lon- don: Methuen; 1973.
[23] Jensen AR. Psychometric g related to differences in head size. Pers Individual Differences 1994;17:597–606.
[24] Jensen AR, Johnson FW. Race and sex differences in head size and IQ. Intelligence 1994;18:309–33.
[25] Jensen AR. The g factor. Westport, CT: Praeger; 1998.
[26] Jensen AR. Clocking the mind: mental chronometry and individual differences. Oxford: Elsevier; 2006.
[27] Jones PB, Harvey I, Lewis SW, Toone BK, VanOs J, Williams M, Murray RM. Cerebral ventricle dimensions as risk factors for schizophrenia and affective psychosis: an epidemiolog- ical approach to analysis. Psychol Med 1994;24:995– 1011.
[28] Kendall IM, Verster MA, von Mollendorf JW. Test performance of blacks in southern Africa. In: Irvine SH, Berry JW,
editors. Human abilities in cultural context. Cambridge, UK: Cambridge University Press; 1988. p. 299–339.
[29] Lynn R. Skin color and intelligence in African Americans. Populat Environ 2002;23:365–75.
[30] Lynn R. Race differences in intelligence: an evolutionary analysis. Augusta, GA: Washington Summit Books; 2006.
[31] Lynn R, Owen K. Spearman’s hypothesis and test score differences between Whites, Indians, and Blacks in South Africa. J Gen Psychol 1994;121:27–36.
[32] Lynn R, Vanhanen T. IQ and global inequality. Augusta, GA: Washington Summit Books; 2006.
[33] Mall FP. On several anatomical characters of the human brain, said to vary according to race and sex, with special reference to the weight of the frontal lobe. Am J Anat 1909;9:1–32.
[34] Malloy J. James Watson tells the inconvenient truth: faces the consequences. Med Hypotheses 2008;70:1081–91.
[35] Morton SG. Observations on the size of the brain in various races and families of man. Proc Acad Nat Sci Phila 1849;4:221–4.
[36] Osborne RT, 1980. Twins: Black and White. Athens, GA: Foundation for Human Understanding.
[37] Pearl R. The weight of the Negro brain. Science 1934;80:431–4.
[38] Risch NJ. Dissecting racial and ethnic differences. New Engl J Med 2006;354:408–11.
[39] Roth PL, Bevier CA, Bobko P, Switzer III FS, Tyler P. Ethnic group differences in cognitive ability in employment and educational settings: a meta-analysis. Personnel Psychology 2001;54:297–330.
[40] Rowe DC. IQ, birth weight, and number of sexual partners in White, African American, and mixed race adolescents. Populat Environ 2002;23:513–24.
[41] Rowe DC. Under the skin: on the impartial treatment of genetic and environmental hypotheses of racial differences. Am Psychol 2005;60:60–70.
[42] Rowe DC, Vazsonyi AT, Flannery DJ. No more than skin deep: ethnic and racial similarity in developmental process. Psychol Rev 1994;101:396–413.
[43] Rushton JP. Japanese inbreeding depression scores: predictors of cognitive differences between Blacks and Whites. Intelligence 1989;13:43–51.
[44] Rushton JP. Mongoloid–Caucasoid differences in brain size from military samples. Intelligence 1991;15:351–9.
[45] Rushton JP. Cranial capacity related to sex, rank, and race in a stratified random sample of 6,325 US military personnel. Intelligence 1992;16:401–13.
[46] Rushton JP. Race, evolution, and behavior: a life history perspective. New Brunswick, NJ: Transaction; 1995.
[47] Rushton JP. Cranial size and IQ in Asian Americans from birth to age seven. Intelligence 1997;25:7–20.
[48] Rushton JP. Testing the genetic hypothesis of group mean IQ differences in South Africa: racial admixture and cross-
situational consistency. Pers Individual Differences 2008;44:768–76.
[49] Rushton JP, Bons TA, Vernon PA, Cvorovic J. Genetic and environmental contributions to population group differences on the Raven’s progressive matrices estimated from twins reared together and apart. Proc R Soc Lond B Biol Sci 2007;274:1773–7.
[50] Rushton JP, Jensen AR. African-White IQ differences from Zimbabwe on the Wechsler intelligence scale for children-
revised are mainly on the g factor. Pers Individual Differences 2003;34:177–83.
[51] Rushton JP, Jensen AR. Thirty years of research on group differences in cognitive ability. Psychol Public Policy Law 2005;11:235–94.
[52] Rushton JP, Jensen AR. The totality of available evidence shows race–IQ gap still remains. Psychol Sci 2006;17:921–2.
[53] Rushton JP, Skuy M, Bons TA. Construct validity of Raven’s advanced progressive matrices for African and non-African engineering students in South Africa. Int J Sel Assess 2004;12:220–9.
[54] Rushton JP, Skuy M, Fridjhon P. Performance on Raven’s advanced progressive matrices by African, Indian, and White engineering students in South Africa. Intelligence 2003;31:123–37.
[55] Scarr S, Weinberg RA. IQ test performance of black children adopted by White families. Am Psychol 1976;31:726–39.
[56] Schoenemann PT, Budinger TF, Sarich VM, Wang W. Brain size does not predict general cognitive ability within families. Proc Natl Acad Sci 2000;97:4932–7.
[57] Schultz AH. Comparison of White and Negro fetuses. In: Davenport CB, Osborn HF, Wissler C, Laughlin HH, editors. Scientific papers of the second international congress of eugenics. Eugenics in race and state (plates 11 and 12), vol. 2. Baltimore, MD: Williams & Wilkins; 1923.
[58] Simmons K. Cranial capacities by both plastic and water techniques with cranial linear measurements of the reserve collection: White and Negro. Hum Biol 1942;14:473–98.
[59] Spearman C. ‘‘General intelligence,’’ objectively determined and measured. Am J Psychol 1904;15:201–92.
[60] Sternberg RJ, Grigorenko EL, Ngrosho D, Tantufuye E, Mbise A, Nokes C, Jukes M, Bundy DA. Assessing intellectual potential in rural Tanzanian school children. Intelligence 2002;30:141–62.
[61] Sternberg RJ, Nokes C, Geissler PW, Prince R, Okatcha F, Bundy DA, Grigorenko EL. The relationship between academic and practical intelligence: a case study in Kenya. Intelligence 2001;29:401–18.
[62] Tang H, Quertermous T, Rodriguez B, Kardia SLR, Zhu X, Brown A, Pankow JS, Province MA, Hunt SC, Boerwinkle E, Schork NJ, Risch NJ. Genetic structure, self-identified race/ethnicity, and confounding in case-control association studies. Am J Hum Genet 2005;76:268–75.
[63] Templer DI, Arikawa H. Temperature, skin color, per capita income, and IQ: an international perspective. Intelligence 2006;34:121–39.
[64] Templer DI. Correlational and factor analytic support for Rushton’s differential K life-history theory. Pers Individual Differences, in press.
[65] Todd TW. Cranial capacity and linear dimensions, in White and Negro. Am J Phys Anthropol 1923;6:97–194.
[66] Vint FW. The brain of the Kenya native. J Anat 1934;48:216–23.
[67] Weinberg RA, Scarr S, Waldman ID. The Minnesota trans- racial adoption study: a follow-up of IQ test performance at adolescence. Intelligence 1992;16:117–35.
[68] Wicherts JM, Dolan CV, Hessen DJ, Oosterveld P, van Baal CM, Boomsma DI, Span MM. Are intelligence tests measurement invariant over time? Investigating the nature of the Flynn effect. Intelligence 2004;32:509–37.
J. Philippe Rushton
Department of Psychology, The University of Western Ontario, London, Ontario Canada
Arthur R. Jensen
The University of California at Berkeley, Berkeley, CA 94720-1670, USA
http://philipperushton.net/wp-content/uploads/2015/02/James-Watsons-Most-Inconvenient-Truth-Race-Realism-and-the-Moralistic-Fallacy-2008-by-John-Philippe-Rushton-Arthur-Robert-Jensen.pdf